Submission to Draft Southern Tasmanian Regional Land Use Strategy
Southern Tasmania's next 25 years are being planned right now. We've had our say.

Today we submitted our response to the draft Southern Tasmania Regional Land Use Strategy (STRLUS) — the document that will shape how our region grows, moves, and develops through to 2050.
And we had a lot to say.
The draft strategy talks a good game about compact settlements, reducing car dependence, and prioritising active transport. But here's the problem: the decisions being made right now are pulling in the opposite direction.
In May 2025, the previous Planning Minister extended the Urban Growth Boundary to allow up to 9,700 new lots in places like Margate, Brighton, and Sorell — before this strategy was even released. That's not infill. That's sprawl. And it locks in exactly the kind of car-dependent development pattern this strategy says it wants to avoid.
We've argued that if the State Government is serious about the vision it's committed to — in the Wellbeing Framework, the Preventive Health Strategy, the Walk Wheel Ride Strategy, and more — then the STRLUS needs to back that up with real priorities. Infill over fringe. People over cars. Investment in the streets and networks that give Hobartians genuine choices about how they get around.
Our full submission is below. Have a read — and if it resonates, share it.
Submission to the Tasmanian Government - Draft Southern Tasmania Regional Land Use Strategy
21st February 2026
Prepared by Ben Clark and Penelope Clark
Reviewed by Hayden Norfolk and Mark Donnellon
Contact [email protected]
Thank you for the opportunity to provide comment on the draft Southern Tasmania Regional Land Use Strategy (STRLUS).
Streets People Love Hobart is a community-led initiative organised by a passionate group of local advocates and supported by many local businesses. Our mission is to advocate for streets that prioritise people, safety, and sustainability. We believe Hobart and population centres across southern Tasmania deserve vibrant, welcoming spaces where everyone can connect, move, and thrive.
Our submission focuses on how our built environment—with the planning framework playing a significant role—can enhance, not hinder, opportunities for physical activity and active travel in daily life.
To begin, we have reviewed the draft STRLUS and the Phase One Consultation Report. We have analysed the Budget commitments over the past decade, and forward estimates, with particular interest in the transport infrastructure investment by Federal and State Governments. We also considered the policy direction that the State Government has committed to, or published in draft form, which should be supported through STRLUS. These included:
Tasmanian Planning Policies (effective 1 July 2026)
Notably section 5.4 Passenger Transport Modes, to provide “…people with modal choice”, including 12 strategies that underpin it such as: Provide an active transport network within key urban areas that is integrated across State and local government networks, and which includes dedicated infrastructure, appropriate signage, and end of trip facilities.
The Wellbeing Framework (2025)
• Tasmanians are supported to live healthy, active lives
• Tasmanians have access to safe, appropriate, and affordable housing in well-designed communities and places
• Tasmanians can safely and affordably get to the places they need and value using diverse transport options
Transport Emissions Reduction and Resilience Plan (2024-29)
• We will increase the use of public and active transport in Tasmania, including a priority to increase all public transport modes used for journeys to work in Greater Hobart from 6.4 per cent to 10 per cent by 2030.
Keeping Hobart Moving - Transport solutions for our future draft (2023)
• Phase 1 (2023-26) identified “Greater Hobart Strategic Active Transport Networks” and “Delivery of Greater Hobart Cycling Plan” as two key projects, which would continue in Phase 2 (2026-29) and Phase 3 (2029-2033)
• Key opportunities will be sought out in the short to medium terms to address key missing connections from our existing spine of All Ages and Abilities (AAA) routes to our four main Central Business Districts (i.e. Hobart, Glenorchy, Kingston and Rosny Park), either as part of other transport and land use projects, or as projects in their own right
The Health Revolution 20-Year Preventive Health Strategy exposure draft (2026-2046)
• Improve our environments for health and wellbeing, including: Safe and accessible public transport, walking and cycling infrastructure connect people to employment, education, shops, services, public open space, and social, cultural and recreational opportunities
“Parking and Sustainable Transport Code” of the State Planning Provisions.
C2.1.2 - To ensure that cycling, walking and public transport are encouraged as a means of transport in urban areas.
Greater Hobart Cycling Plan, 2021
• a connected network of 291km, specified as AAA standard
draft Tasmanian Walk, Wheel, Ride Strategy, 2024
• that 50% of short trips (<5km) are by walking and cycling by 2034 (from a baseline of 30% in 2023), and
• a doubling in the walk and cycle to work rates (from baseline of 5%/1% in 2021, to 10%/2% in 2034)
In our view, the STRLUS should be helping deliver the vision - as committed to by the State Government in the above documents. Therefore, we offer the following comments and suggestions, which for ease of review, we have listed in the same order as presented in the draft STRLUS document.
1.1 -Purpose of the regional land use strategies
We feel that the seven dot points regarding what a RLUS can influence are missing any reference to how we move around the region. Therefore, we suggest adding an eighth dot point:
• Supporting safe, efficient and accessible transport network that provides people with modal choice and is well integrated with land use.
1.6 The STRLUS and climate change
We support the six strategies outlined to reduce greenhouse emissions and increase resilience.
We feel it is important to note that the previous Planning Minister’s decision to extend the Urban Growth Boundary in May 2025 (pre-emptive of this draft STRLUS) to allow for up to 9,700 lots in locations including Margate, Brighton and Sorell is contrary to the first two strategies.
• promoting compact settlements to decrease reliance on private transport, increase active transport opportunities and reduce greenhouse gases
• reducing urban sprawl and greenfield development to protect our environmental values which can act as carbon sinks and support increased resilience to climate change
It was a view shared by many respondents at that time, as it will encourage further urban sprawl rather than urban infill, particularly as developers find these greenfield sites easier to develop than infill. When those areas are developed, it is likely to increase reliance on private transport (as was noted by Department of State Growth in their submission[1]).
Figures 4 and 5 (pp. 19-20)
We realise at the scale of these maps it might be hard to distinguish the network as outlined in the Greater Hobart Cycling Plan, however every other major transport mode is referenced. If possible, it should be shown on Figure 5: Metropolitan Hobart in 2050
Our suggestion is that if that can’t be done, then within the Legend for Figure 4: Southern Tasmania in 2050 (suggest it be inserted directly below the AAD symbol), add the note:
• Greater Hobart Cycling Plan is an endorsed All Ages and Abilities (AAA) cycle network of 291km connecting the Hobart CBD with most Principal Centres and District Centres.
Table 1 (p. 22) - 1. Growth Management
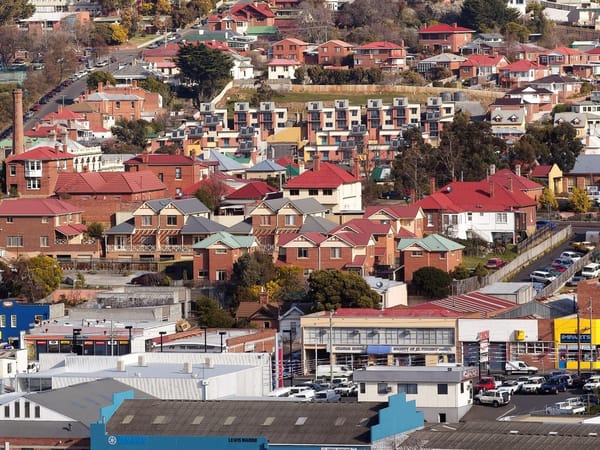
There is no reference to the earlier stated aims for infill to be prioritised over greenfield development. Based on the first two decades of the century (2001-2021), where Hobart’s housing stock had a greater increase in the percentage of single detached dwellings rather than medium density dwellings, we feel it must be more emphatic. Our suggestion is to change the Statement of Intent from:
Cities, towns and villages grow sustainably and efficiently. Our communities are supported as they grow and change, and are diverse, connected and productive.
to
Prioritise and encourage infill development, consolidation, redevelopment, re-use and intensification of under-utilised land within existing settlements, prior to allocating land for growth outside existing settlements
We strongly support Outcome 1.4 - New housing is located to prioritise access to employment and services and to take advantage of active transport, linear open space and public transport networks.
We do note that Greater Hobart doesn’t have sufficient active transport infrastructure for its population. Therefore, an amendment to Outcome 1.5 is suggested, from:
Land use planning incorporates measures to promote community health and wellbeing.
to
Land use planning incorporates measures to promote community health and wellbeing, particularly through expanding cohesive active transport networks within our cities, suburbs and towns.
Table 1 (p. 24) - 5. Physical Infrastructure
We strongly support Outcome 5.1 - Compact urban form, encouraging infill and densification, provides for efficient use of all infrastructure and services to improve social, environmental and economic outcomes.
3.1.1 Overview (pp.26-27, within Growth Management chapter)
We agree with the analysis in paragraphs 4-5 noting the prevailing development pattern of low density development on the city fringe has significant costs in terms of transport infrastructure and limiting transport modal choice. We suggest an additional two sentences (in italics) near the end of Paragraph 5 (with the remaining sentence re natural hazards to follow):
…It is less cost effective and often impracticable to extend or improve public transport services, leading to more car use, poor access to public transport, and less walking and cycling. Comparatively, by prioritising infill development, complemented by an improved active and public transport network, it will be more cost-effective over the next 25 years. This will increase trips by active transport and public transport, which will reduce congestion, as well as improve population health outcomes.
Figure 8 - Growth management targets (p.29)
Noting the projection for 27,665 more dwellings from 2023-2046, and that 39% additional households will be sole occupancy[2], we strongly support the targets for a minimum of 50% of new dwellings in the Metropolitan Urban Boundary to be medium density typology. Noting that the past 15 years since the initial STRLUS was developed has fallen far short of that ambition, it will be important for the State Planning Office to work with the local governments to ensure that Local Planning Schemes and zones are targeting this type of development.
We strongly support the target to prioritise Active transport within 400m of District Centres, and Service Hubs, and 800m of Principal Centres. These have often been hard to implement due to pressure from trading groups, concerned about any loss of vehicle parking and convenience. We call on the State Government to play a leadership role in helping local government implement this, particularly through funding support.
3.1.2.1 - Growth management strategy (p.30)
The Environment Design Guide report on ‘The Cost of Urban Sprawl, Infrastructure and Transportation’, lists the cost of initial capital cost for redevelopment versus fringe development to be $50,502,726, vs $136,041,065[3]. Noting these costs were from a 2010 article, they will have increased substantially since then, however they do give an indication of comparative cost efficiency of redevelopment.
The order in which the sub-strategies are presented implies that urban consolidation is the final option - as (d). Given the aforementioned growth target of 50% medium density, the cost efficiency of redevelopment, and the emphasis to urban consolidation in section 1.1.3.2.a) of the Tasmanian Planning Policies (TPPs), we suggest it is elevated. Therefore, what is currently (d) - urban consolidation - is elevated to become (b), and then current (b) and (c) become (c) and (d). We also suggest a slight rewording, to align with the emphasis in the TPPs on ‘prioritise and encourage infill development…prior to allocating land for growth outside existing settlements’, so it changes from:
Provide for urban consolidation, including higher density residential development….
to
Prioritise urban consolidation, including higher density residential development….
We also support the requirement in what is currently (c)iii.; that urban growth that provides for additional residential land is to demonstrate capacity of transport networks to support the anticipated population…and measures to encourage more public transport and active transport use. Based on that requirement many of the parcels which were added to the Urban Growth Boundary in May 2025 would not meet this requirement, as noted by Department of State Growth[4].
3.2.2.1 - Biodiversity and geodiversity
We strongly support the sub-strategies within this section. We see significant potential for enhancing urban biodiversity through implementing green corridors along pedestrian and cycle paths as envisioned through (f)(i.-iii.). With State Government leadership and co-funding commitment, the remaining 208km of the 291km All Ages and Abilities network (as outlined in Greater Hobart Cycling Plan) could be implemented within the expected 25 year life of the STRLUS.
3.4.1 - Overview (p.49 within Sustainable Economic Growth),
The third last paragraph on this page, headed ‘Transport networks…’ is too limited, in only focusing on roads and rail, largely from the freight and logistics perspective. We also feel the sentence starting with ‘Continued outward growth…’ sets the scene for more of that development pattern, so a countering sentence to follow would help - and reinforces points made in 3.4.2.6 (f-j) on page 52. Suggested addition is:
Strategic rezoning within the existing urban footprint to increase density and better use existing infrastructure and public transport will be a more sustainable pattern of economic growth.
In order to align with the TPPs (section 5.4 - Passenger transport modes) the paragraph also needs to acknowledge public and active transport networks as essential. Suggested addition to end of paragraph:
The State investment in expanding the passenger ferry network, and providing high frequency public transport corridors has significant potential to reduce peak demands on the road network. Investment in an active transport network within urban areas, which includes dedicated infrastructure, signage and end of trip facilities would improve modal choice and population health outcomes.
3.4.3 - Table 3, Activity Centre categorisation
For Hobart CBD, within the Catchment and Access row, we suggest adding:
Greater Hobart cycle network, suitable for all ages and abilities, to provide connections through Hobart CBD.
3.5.1 - Overview (within Physical Infrastructure)
To support the whole of Government ambitions in “The Wellbeing Framework” and “20-year Preventive Health Strategy exposure draft”, we suggest adding a sentence to the end of the first paragraph:
Physical infrastructure also needs to support us to live healthy, active lives.
To support the whole of Government ambitions in the Medium Density Design Guidelines, we suggest adding a sentence to the end of the third paragraph:
Shifting to a medium density housing pattern in proximity to activity centres will encourage residents to use a more diverse range of transport options – including bicycles, car shares, walking and mobility scooters.
3.5.1.3 - Transport (within Physical Infrastructure)
We strongly support the context in this section, and note the 2025 Hobart Neighbourhood Greenways Study[5] which determined 83% of streets in Hobart LGA had bike-friendly slopes. To offer some optimism to the discussion about road building and public transport economics, we suggest adding this sentence to end of third paragraph:
The implementation of the Greater Hobart Cycling Plan, with 291km of dedicated infrastructure suitable for all ages and abilities, offers a viable transport alternative, that can be delivered within the 25 year life of this strategy.
3.5.1.3 - Passenger transport modes (within Physical Infrastructure)
We strongly support these strategies (a-e). We note that the 2025 Hobart Neighbourhood Greenways Study used a data driven mapping approach to determine bikeability, which also took into account human experience at street level. We recommend this approach be used to develop a “Bikeability Analysis for Greater Hobart”, and include this as new Figure 19. Lead author was Oliver Oglesby (Harvard) and key contact at City of Hobart is Daniel Verdouw.
4.1 - Roles and responsibilities
We feel this section underplays the State Government’s role in funding large scale infrastructure projects and the role this has in supporting or undermining the STRLUS. Analysis of the past decade's State Budgets (2016-17 to 2025-26) shows that the combined State allocation to Roads and bridges was $2.2 billion (and as a total, with Federal contributions, was $4.33 billion)[6]. Over a similar period (albeit starting a year earlier, from 2015) there was $17.5 million allocated by State government, which is 0.8% of the State’s road allocations. International best practice, when looking to achieve modal shift to active transport, is for 10% of the roads budget to be dedicated for active transport infrastructure[7].
The situation over the coming three budgets is worse, $1.22 billion allocated to road and bridge projects, and $0 to active transport. This will continue to embed the prevailing low density development pattern, with major road expansions to service communities at the fringe of the Metropolitan Urban Boundary (or beyond, in cases of Dodges Ferry, South Arm, Huonville, and the like). By comparison, if we adopted the international best practice, and allocated 10% of the $1.22 billion road budget, to active transport, it could enable up to 61-kilometres of AAA networks in Hobart and settlements around Tasmania to be built.
It then makes it even harder to achieve the shift to active transport, when the protected cycle infrastructure that many commuters in Greater Hobart said would be the biggest incentive to riding more isn’t being built[8]. We suggest adding this sentence to end of fourth paragraph:
As part of the Tasmanian Government Budget submission process, any capital projects in Southern Tasmania should be assessed against the STRLUS objectives and strategies.
We would also recommend the projects be assessed against relevant Government policies to increase rates of physical activity and active transport (i.e. The Wellbeing Framework (2025), Tasmanian Walk, Wheel, Ride Policy (2024), Transport Emissions Reduction and Resilience Plan (2024-29), and Greater Hobart Cycling Plan, 2021).
Appendix 1 - Structure Plans for growth management and Activity Centres
We support the measures outlined for (a), (b) and (c) that require Structure Plans to demonstrate adequate provision of public open space active transport networks, as well as multi-purpose green corridors. We strongly support the prioritisation of pedestrians and active transport over cars, as outlined in (c)iii. active street frontages (iv.), and landscaping and street furniture to provide amenity and emphasise centres as places for people to congregate (vi.).
We trust this is helpful in finalising the STRLUS.
Yours sincerely
Mark Donnellon
President – Streets People Love Hobart
[1] extract from Submission 95, Department of State Growth - “Modelling undertaken by State Growth indicates that the proposed expansion will see an increase in traffic volumes on many key roads, together with an increase in travel distances and travel times. Travel times are predicted to increase at a disproportionately higher rate compared to additional travel distances. This will particularly be an issue on the Tasman Highway.”- https://www.stateplanning.tas.gov.au/__data/assets/pdf_file/0004/569164/STRLUS-Urban-Growth-Boundary-submissions-51-95.pdf
[2] from Fig.7 - Housing forecasts for Southern Tasmania, p.28
[3] Trubka, R. Newman, P. and Bilsborough, D. 2010 EDG62_GEN83_Paper.indd, p3.
[4] extract from Submission 95, Department of State Growth - The State Road network across Greater Hobart is close to capacity at peak times. Future demand on the State Road network in the region that is not accommodated by other modes will increase overall average travel times and decrease travel time reliability. Opportunities to cost effectively expand the State Road network to cater for growth in outer urban areas are limited, noting geographic, environmental, and adjacent land use constraints.
[5]Refer to p.10 - Bike Suitability Analysis https://www.hobartcity.com.au/files/assets/public2/v/2/services/transport-and-traffic-management/bike-riding/neighbourhood-greenways-study-v2.pdf
[6] Tasmanian Government, Budget Paper 1, Tables 6.3 -(2016-17 to 2018-19), Tables 6.4 (2019-20 to 2024-25) and Table 7.5 (2025-26)
[7] Adhikari, Ryan, Harrington, 2024, Proactive investment: Policies to increase rates of active transportation - Discussion Paper. The Australia Institute
[8] Greater Hobart Household Travel Survey | Overview of travel behaviour – 2019 to 2023, Figure 35 Main factors likely to encourage greater cycling use, p. 46 https://www.transport.tas.gov.au/__data/assets/pdf_file/0004/587560/Greater-Hobart-Household-Travel-Survey-Summary-report-v1.0.pdf