Submission to Exposure draft of The Health Revolution - 20-Year Preventive Health Strategy

The Tasmanian Government released the exposure draft of The Health Revolution – its 20-Year Preventive Health Strategy – back in December, with public consultation closing today (27 February). We've been involved in this process since Round 1 in May 2025, and were also invited to a Round 2 workshop on Transport and Active Travel earlier this week.
Read our first submission to the Feedback for 20-Year Preventative Health Strategy
The Strategy is ambitious. It covers five pillars – healthy environments, healthy people, healthy communities, healthy foundations and healthy systems – and sets a 20-year vision backed by rolling four-year action plans. The language is refreshingly plain, and we're genuinely pleased to see references to street safety, active transport, and town planning that puts people first. That said, the goals lack measurable targets, and the funding commitments are still vague. So we made sure our submission addressed both.
Our submission, prepared by Ben Clark and reviewed by me, makes the case that designing streets and places for walking and riding doesn't just improve transport and access, it's a health intervention that will keep more Tasmanians fitter and stronger for longer. We highlighted that fewer than 2 in 10 Tasmanian adults meet physical activity guidelines, that the State spends just 0.8% of its road budget on cycling infrastructure (international best practice is 10-20%), and that at the current rate of progress the Greater Hobart Cycling Plan won't be completed for another 80-130 years.
We also drew on SPLH's concurrent submission to the Southern Tasmania Regional Land Use Strategy to argue that continued urban sprawl directly undermines preventive health goals, and referenced the Productivity Commission's finding that every $1.5 billion invested in prevention could save governments $2.7 billion over a decade.
New in this submission: we recommended Tasmania adopt the NSW Active Transport Health Model to quantify the health benefits of cycling infrastructure projects, advocated for 30 km/h speed limits where people walk and ride, and called for the Strategy's alignment map to explicitly include the Greater Hobart Cycling Plan, the Walk Wheel Ride Strategy, and the Tasmanian Planning Policies.
You can read our full submission below.
Submission to the Tasmanian Government - The Health Revolution
20-year Preventive Health Strategy exposure draft
27th February 2026
Prepared by Ben Clark
Reviewed and submitted by Mark Donnellon
Contact [email protected]
This submission includes contributions from professionals working in a volunteer capacity for Streets People Love Hobart. The views expressed are those of Streets People Love Hobart as an organisation and do not represent the positions of contributors’ employers.
Thank you for the opportunity to provide feedback on Tasmania’s 20-Year Preventive Health Strategy exposure draft (the Strategy).
Streets People Love Hobart is a community-led initiative organised by a passionate group of local advocates and supported by many local businesses. Our mission is to advocate for streets that prioritise people, safety, and sustainability. We believe Hobart and population centres across Tasmania deserve vibrant, welcoming spaces where everyone can connect, move, and thrive.
We note there have been many changes from the content provided in the Discussion Paper.
We have aligned our comments to your suggested questions. Where we feel extra emphasis (or an edit) is needed, we have provided specific wording.
1. How does the long-term vision in this draft feel to you?
We endorse the vision, particularly the phrase “-through environments that make healthy choices easier, communities that are safe and connected…”
We endorse the five pillars, and the 14 principles that guide all decisions.
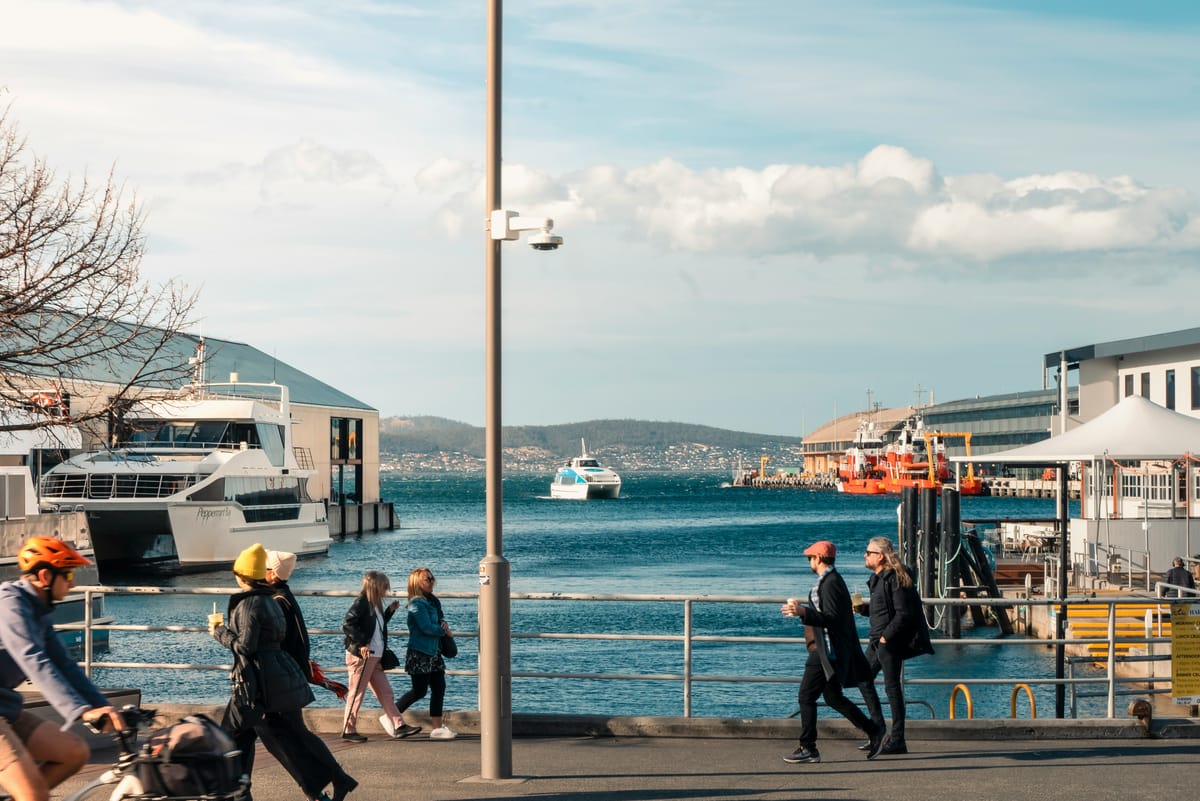
2. What do you think about the visuals and tagline?
The visuals lack diversity (especially compared to the Discussion Paper).
- Given nearly 1 in 5 Tasmanians have some sort of mobility impairment, could some images of people with mobility aids also be included?
- To reflect Tasmania’s diverse population, more cultural, age and body shape diversity within the imagery would also be welcome.
We are surprised by the lack of infographics. Looking at other preventive health strategies there are usually some health infographics (as was the case in the Discussion Paper). Will these be reintroduced for the Implementation Plans?
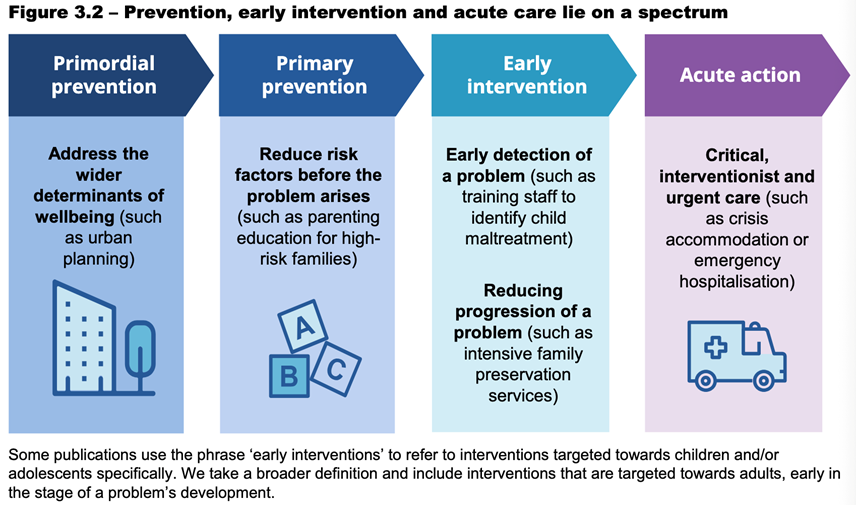
One visual we think would be helpful is an illustration of the spectrum of healthcare so non health professionals reading this can understand the levels within preventive health, and how each reinforces the overall health system (refer Figure 3.2 overleaf, sourced from the Productivity Commission Inquiry report).
3. Does the strategy reflect the things you believe keep Tasmanians well?
“Where health really comes from”
This is enticingly written and we are pleased with the reference to “the safety of the streets we live on”. The emotive tone offers hope for a future where elected leaders listen to the experts and allocate an adequate budget for these programs and initiatives, knowing the benefits may not materialise for many years.
This point is reinforced recently by the Productivity Commission:
Australian, state and territory governments have recognised the need for greater prevention and early intervention efforts. But silos within government, short-term budget cycles, limited evaluations and scepticism that programs will deliver fiscal savings pose barriers to sufficient government investment[1].
Suggestions:
|
Page |
Paragraph |
Comment |
Proposed edit (italics) |
|
9 |
8 |
This section could do more to acknowledge the role of built
environment in enabling healthy activity in our daily life |
It’s about the kind of life we’re able to live. Designing our
communities so it is safe and easy to walk or ride to study, shops, work or
for fun. We’re choosing to keep people well… |
|
9 |
11 |
Should acknowledge long-term thinking isn’t enough on its own -
requires funding to implement |
It’s promise to
think long-term, and to fund the programs and projects that will
help deliver a healthier Tasmania. |
A ‘report card’ (as was in the Discussion Paper) with statistics that help underline the challenge we face would be a valuable inclusion. We consider the following two statistics worthwhile including:
- Fewer than 2 in 10 Tasmanian adults currently meet weekly physical activity guidelines.
- Only 3 out of 10 Tasmanian children do enough physical activity for good health[2].
“How we built this: there was no guesswork”
We’re interested in the cost-effectiveness evaluation. Could the Final Strategy include an outline of how much each issue is costing Tasmania and what actions give the best value for money?
“No reinventing the wheel here / Got the experts in”
We note the State’s previous investment in convening the Tasmanian Climate Change and Health Roundtable (and the participants’ commitment to bringing their ideas). To honour that collective expertise, we suggest that the actions identified in Table 1: Tasmanian Climate Change and Health Roundtable: Priority areas and identified actions[3] be incorporated into the 20-year Preventive Health Strategy. Of note we highlight the following actions:
Priority 1: Health promoting and emissions reducing policies
- Develop a state policy for healthy spaces and places
- Increase active travel options:
- bike lanes
- accessible public transport
- support employees to purchase bikes/use healthy transport (consider perverse disincentives and FBT implications)
Priority 3: Supporting health and resilient communities
- Promote liveability agenda
- Community engagement
- State planning policies influenced
- Develop planning legislation supporting community action to support health
With a changing climate, there will be increased need for our urban environments to be adapted to cope with increased peak rainfall intensity, and more canopy. Our group sees these outcomes as being complementary to the design of people-friendly places. We have taken inspiration from a number of award-winning projects interstate and internationally that have achieved urban design outcomes that improve liveability, movement, and climate control through careful infrastructure design and planting selections[4].
4. Do the pillars and sub-pillars feel like the right ingredients in the recipe?
Pillars: our recipe for living well
Pillar 1- Healthy environments and places
The State Planning Office is currently updating the Southern Tasmania Regional Land Use Strategy (STRLUS), which may last for up to 25 years (the current iteration has lasted 15 years). We made a strong case that the extension of the Urban Growth Boundary and continued low-density fringe development directly undermines preventive health goals by embedding car dependency.
This is highly relevant to the Preventive Health Strategy and the alignment map toolkit. We recommend the Preventive Health Strategy should acknowledge that land use planning decisions can either support or undermine its objectives.
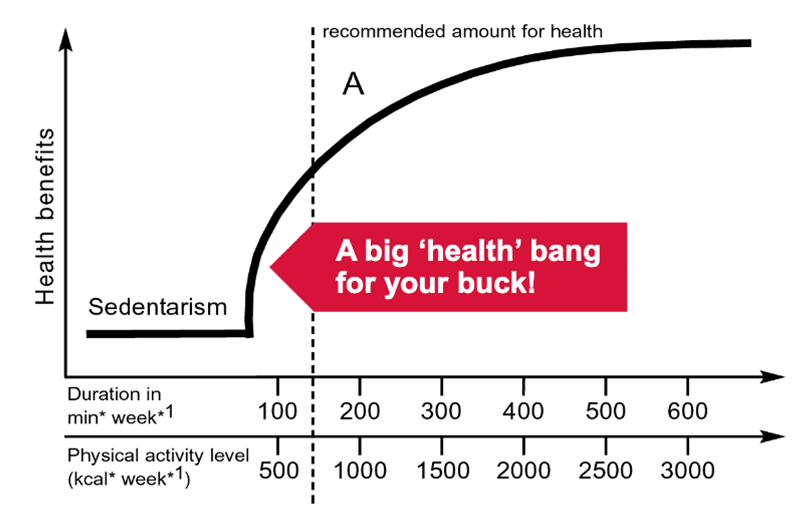
Pillar 2 - Healthy people and potential
We believe physical activity should be a focus for the Strategy as it helps to reduce the risk of major illnesses such as diabetes, cancer and heart disease, and improves quality of life. The following graph illustrates the significant health gains with increased ‘dose’.
Sub-pillars
Yes, however we are concerned that the goals for each sub-pillar aren’t Specific, Measurable, Achievable, Realistic or Time-bound. We presume that might come at the Implementation Plan stage but would like that to be confirmed.
As an example, the Transport and active travel goal (“We get around safely, easily and without fuss…”) could either be replaced with a stronger aspiration, like this statement adapted from the Heart Foundation:
Ensure that the design of streets and public space prioritises the needs of people over motor vehicles[5], so that it is convenient, comfortable and safe for Tasmanians of all ages and abilities to walk, ride and move around our cities.
Or, be more specific about the change we are aiming for, and include the targets for modal shift, with this example taken from the draft Tasmanian Walk, Wheel Ride Strategy, 2024:
Increase the percentage of short trips (<5km) by walking and cycling from 30% to >50% by 2034.
Similarly, the goal for Buildings, places and spaces (“Tasmania’s towns and suburbs look after us...) reads as though it could apply to almost any form of development. Taking the lead from the National Preventive Health Strategy would aspire for development that improves health through increased activity:
Opportunities for physical activity must also be accessible and the environments in which we live, work, play, and age need to support us to be more active more regularly.
Or, be more specific about the change we are aiming for, with this example from the National Preventive Health Strategy, 2021-2030[6]:
Reduce the prevalence of insufficient physical activity amongst children, adolescents and adults by at least 15% by 2030
The Injury prevention goal notes that ‘safety is part of how our places are designed’. This goal could be strengthened with a specific note that lower urban speed limits are an evidence-based preventive health intervention. We advocate for 30 km/h speed limits where people walk and ride, given the exponential increase in serious injury risk (for pedestrians and cyclists) above that speed (as per Figure 1).
5. Do the ways we’ll make this happen feel complete?
We look forward to reading the Evaluation and learning framework. We propose the following targets being part of the data that is measured. Some of these are from existing drafts or endorsed Tasmanian Government strategies, so should be readily incorporated (with the relevant lead agency accountable for the data recording):
Increase the percentage of short trips (<5km) by walking and cycling from 30% to >50% by 2034[7].
Increase the percentage of short trips completed by walking and cycling to places of education from 18% to >36% by 2034
Increase the percentage of people who walk and cycle to work from 5%/1% to 10%/2% by 2034.
Increase in kilometres of cycle infrastructure that is “All ages and abilities” (AAA) standard[8]
We are very interested in the Governance model, and authorising environment.
We agree that the strategy requires leadership at all levels, collaborative efforts across Departments and the health sector, with independent oversight.
We also are very keen to understand the funding model, and rules that protect long-term investment, and the protections that help prevention survive election cycles. As the Productivity Commission recently noted at a national scale:
…the benefits of prevention and early intervention can take a long time to materialise and may not align with budget cycles, government departments or tiers of government…An investment of $1.5 billion over five years could save governments $2.7 billion over ten years. When broader health, social and economic benefits are included, the net present value of total expected benefits would be around $5.4 billion over the same period[9].
Our analysis of the past decade’s State Budgets (2016-17 to 2025-26) shows that the combined State allocation to Roads and bridges was $2.2 billion (and as a total, with Federal contributions, was $4.33 billion)[10]. Over a similar period (albeit starting a year earlier, from 2015) there was $17.5 million allocated by State government for cycle infrastructure, which is a mere 0.8% of the State’s road budget allocations. International best practice, when looking to achieve a significant modal shift to active transport, is for 10-20% of the roads budget to be dedicated for active transport infrastructure[11].
As a thought experiment, had Tasmania followed that best practice advice, and invested the 10% of roads and bridges budget (thus $433 million) in active transport infrastructure over that decade, we could have completed the remaining 208km of the AAA network as endorsed in the Greater Hobart Cycling Plan [12]. Based on the recent rate of progress, the network wouldn’t be completed for another 80-130 years[13]. We see one of the great potential outcomes of this 20-year Preventive Health Strategy would be to champion the completion of this project within its lifespan.
To illustrate the return on investment had this $433m been invested, using metrics that Department of State Growth had in the draft Walk Wheel Ride Strategy, it would generate:
- Total of $2.16b economic return (based on a $5 return for every dollar invested in walking and cycling infrastructure[14]), including
- $56.5m per annum in health benefit - on the conservative presumption this infrastructure achieves a 1% modal shift, in that an additional 7,294 of the 729,400 daily trips were taken by bike (we used Greater Hobart Household Travel Survey 2023 data, with an 8.7km average trip distance).[15]
As a local example, the City of Hobart’s investment in the Hobart Rivulet Track over the past 20 years sets a strong precedent. The rates of cycling to work by South Hobart residents increased from 2% in 2001, to 5% in 2011, and 7% in 2021 (ABS Census, 2001, 2011, 2021). We expect to see this rate increase at the next census, with the tactical trial of protected cycle lanes along Collins Street improving the connection to the city centre.
Frustratingly, the funding situation over the coming three State budgets is worse, with $1.22 billion allocated to road and bridge projects, and $0 to active transport[16]. If a preventive health lens were to be applied, and Tasmania adopted the lower end of the international best practice range, and allocated 10% of the $1.22 billion road budget to active transport, it would enable design, and works to significantly scale up (up to 61-kilometres of AAA networks in Hobart, and settlements around Tasmania), to be built over the coming three years. Longer-term the state could aspire to reaching the 20% active transport investment target.
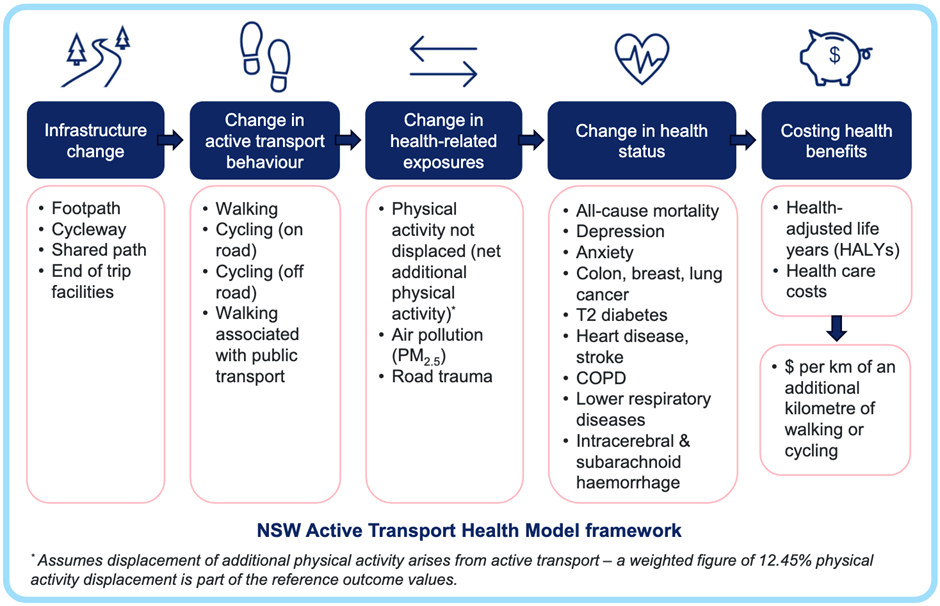
Our point is, these investments must start soon and should not be considered optional, even in a tight budgetary situation. By applying a preventive health lens to the analysis, particularly if there were an actuarial microsimulation model that can predict how much the population health benefit result may be, would improve the chance of these projects being funded (Figure overleaf, sourced from the NSW Active Transport Health Model, outlines a framework for this).
We recommend the hypothetical case study presented for a 1.1km separated cycleway in Randwick (inner Sydney) as a sound basis for Tasmania to consider modelling our own active transport projects[17]. In that case it estimated a total lifecycle cost of $1.15m (presuming the infrastructure had a 30 year life) would generate health benefits of $6.4m, resulting in a Net Present Value of $5.3m. This represented a Benefit Cost Ratio of 6.0, which is significantly higher than major road projects (although not many are publicly available, for the Midway Point Causeway duplication Department of State Growth reported a BCR of 2.2[18]).
We are keen to see this model applied by Department of Health - in collaboration with Department of State Growth - to compare the health costs created by investment in future road projects and active transport design solutions within the same catchment. Such an approach could bring a significant shift in the budgetary allocation process.
We also looked at how the State has budgeted for preventive health; it was difficult to determine the amount and percentage allocated. Public Health Services accounts for around 1% of the overall state health budget however we considered this is only a proxy measure for preventive health funding (as preventive care delivered through hospitals wouldn’t be counted). We also note that this has steadily declined as a percentage of the health budget from 2% in 2016-17, to a projected 0.9% in the coming three budgets.
We would like to see the funding model clearly identify what the State spends on preventive health. The model should also set a target, and we recommend 5% as the starting point, based on the Productivity Commission:
The Australian Government’s National Preventive Health Strategy acknowledges this shortfall, and sets a target of 5% for the share of total government health expenditure going into prevention by 2030 (DoH 2021c). While this target is somewhat arbitrary, it reflects the reality that the scale of funding needs to be large enough to make a meaningful difference. Evidence from Canada suggests that higher public health expenditure is associated with a long-run decrease in preventable mortality and that failure to fund prevention adequately may harm populations over time (Ammi et al. 2024)[19].
We would like to see the Alignment map explicitly include the STRLUS, the Greater Hobart Cycling Plan, the Tasmanian Walk, Wheel, Ride Policy, the Walk Wheel Ride Strategy, the Tasmanian Cycling Infrastructure Design Guide and the Tasmanian Planning Policies as key aligned documents — demonstrating the whole-of-government approach the Strategy aspires to.
6. Is the language clear and easy to understand?
Yes, it is written in a plain style that is clear and uplifting. We understand it would be difficult to distil the volume of material into something that is able to be read at a Grade 6 level. We are concerned that it doesn’t have some technical underpinning - in that there is no discussion of the five main types of prevention. We presume that might come at the Implementation Plan stage.
7. Does this plan make you feel included in Tasmania’s long-term health journey?
Yes. As noted in the draft Tasmanian Walk, Wheel, Ride Strategy, 2024, there has been a term ‘bike-lash’ to describe the resistance to redesigning streets where it reduces on-street parking. The strategy noted the value of meaningful engagement with stakeholders, and we are keen to work with State and local governments to help gain broader community support.
We trust this is helpful in finalising the Strategy, and we welcome being a part of any ‘roundtable’ or future consultation sessions that the Department organises to develop the implementation plans or other supporting documents.
Yours sincerely,
Mark Donnellon
President – Streets People Love Hobart
[1] Productivity Commission, p. 57, Section 3: A national framework to support government investment in prevention and early intervention, Delivering Quality Care more efficiently: Inquiry report, Dec 2025
[2] Department of Health, (2022). Healthy Tasmania Five Year Strategic Plan 2022-2026 https://www.health.tas.gov.au/sites/default/ files/2022-03/Healthy_Tasmania_Five-Year_Strategic_ Plan_2022%E2%80%932026_DoHTasmania2022.pdf
[3] Tasmanian Climate Change and Health Roundtable Final Report June 2020
[4] Sheffield, UK - Grey to Green
[5] National Heart Foundation of Australia’s Blueprint for an Active Australia noted this in Action Area One, Built Environment
[6] Department of Health, 2021, National Preventive Health Strategy, 2021-2030, p.55
[7] draft Tasmanian Walk, Wheel Ride Strategy, 2024
[8] Tasmania Cycling Infrastructure Design Guide, refer Table 2.1, Figures 4.1, section 4.3.5 - 4.3.8 for requirements.
[9] Productivity Commission, p. 57, Section 3: A national framework to support government investment in prevention and early intervention, Delivering Quality Care more efficiently: Inquiry report, Dec 2025
[10] Tasmanian Government, Budget Paper 1, Tables 6.3 -(2016-17 to 2018-19), Tables 6.4 (2019-20 to 2024-25) and Table 7.5 (2025-26)
[11] Adhikari, Ryan, Harrington, 2024, Proactive investment: Policies to increase rates of active transportation - Discussion Paper. The Australia Institute
[12] Separated cycle path (AAA standard) costing an estimated $2.0-$3.9 million per kilometre, as per Australian Transport Assessment and Planning (2023) Australian transport assessment and planning guidelines M4 Active travel, p 55, https://www.atap.gov.au/mode-specific-guidance/active-travel/index . Using this metric, $433m equates to 111-216.5km of AAA infrastructure.
[13] https://hobartstreets.au/greater-hobart-cycling-plan/#report projects a completion year of 2105, however due to slower than average progress the City of Clarence wasn’t projected to until 2155, Hobart until 2157, State Government until 2156.
[14] valuation metric sourced by Dept of State Growth from Queensland Department of Transport and Main Roads (2023); Queensland Cycling Infrastructure Investment Strategy and Business Case 2016–2026
[15] This would roughly equate to a doubling of the daily trips by bike which was 7,900, as per Table 10 on page 14 of the GHHTS Summary report. The valuation metric of $2.44 in health benefits to the economy for every kilometre cycled, sourced by Dept of State Growth from Wanjau, M, Möller, H. Haigh, F. Zapata-Diomedi, B. Veerman, L. (2022). Griffith University, The George Institute for Global Health & University of New South Wales
[16] Tasmanian Government, Budget Paper 1, Table 7.5 (2025-26)
[17] NSW Active Transport Health Model, A best-practice model for valuing the health and economic benefits of active transport initiatives NSW Ministry of Health, Centre for Population Health, NSW Ministry of Health, 17 April 2025, pages 9-11 - https://www.transport.nsw.gov.au/system/files/media/documents/2025/Active-Transport-Community-of-Practice-Ministry-of-Health-Active-Transport-Health-Model-April-2025.pdf
[18] page 9, 2025, Parliamentary Standing Committee on Public Works, Tasman Highway: Duplication Of Midway Point Causeway And McGees Bridge (South East Traffic Solution)
[19] Productivity Commission, p. 64, Section 3: A national framework to support government investment in prevention and early intervention, Delivering Quality Care more efficiently: Inquiry report, Dec 2025