Tasmania's 20-Year Preventive Health Strategy
SPLH wrote a submission for Tasmania's 20-Year Preventive Health Strategy, but what has preventive health got to do with our built environment?
The Tasmanian Government's Department of Health is currently developing a 20-Year Preventive Health Strategy. Streets People Love Hobart made a submission during the initial consultation period, which you can read in full, below.
So, what is 'preventive health', why does this new government strategy matter, and what does it have to do with our organisation, anyway?
- Preventive health focuses on changing systems and environments to support healthy lifestyles and reduce reliance on medical services. It improves wellbeing while easing pressure on healthcare systems.
- Streets People Love Hobart advocates for a city designed around people, safety, and sustainability. Preventive health should support safer active transport, climate resilience, and stronger community connection.
- The 20-Year Preventive Health Strategy outlines actions the Tasmanian Government can take over the next twenty years, in four-year phases, to improve public health with preventive measures. It's a unique opportunity for us to submit feedback, highlighting the need for better investment in active transport, climate-conscious place-making, and fostering community wellbeing.
Our Submission
Thank you for the opportunity to contribute ideas for the development of Tasmania’s next 20-Year Preventive Health Strategy (the Strategy).
Streets People Love Hobart is a community-led initiative organised by a passionate group of local advocates. Our mission is simple: to design streets that prioritise people, safety, and sustainability. We believe Hobart deserves vibrant, welcoming spaces where everyone can connect, move, and thrive. (We also believe that applies equally to other cities and towns across the state!)
We feel that the strategy requires leadership at all levels, collaborative efforts and persistence to effect change. We consider factors beyond the health sector need to be addressed, which include the places where people live, learn, work and play.
We believe physical activity should be a focus for the Strategy as it helps to reduce the risk of major illnesses such as diabetes, cancer and heart disease, and improves quality of life.
This is underscored by two important statistics that do not appear in the ‘report card’ on page 10 of the Discussion Paper:
- Fewer than 2 in 10 Tasmanian adults currently meet weekly physical activity guidelines.
- Only 3 out of 10 Tasmanian children do enough physical activity for good health.[1]
We have read the Discussion Paper and have focused our response on the specific questions that relate to these outcomes.
1. What does a healthy, active life mean to you and your community?
We were very pleased to read the recent comments by Public Health Association of Australia’s CEO, Adj Prof Terry Slevin “We need actions like making it easier for people to build walking or riding into their daily lives”.[2]
A “healthy, active life” means one in which it is convenient, comfortable and safe for people of all ages and abilities to walk, ride and move around our cities.
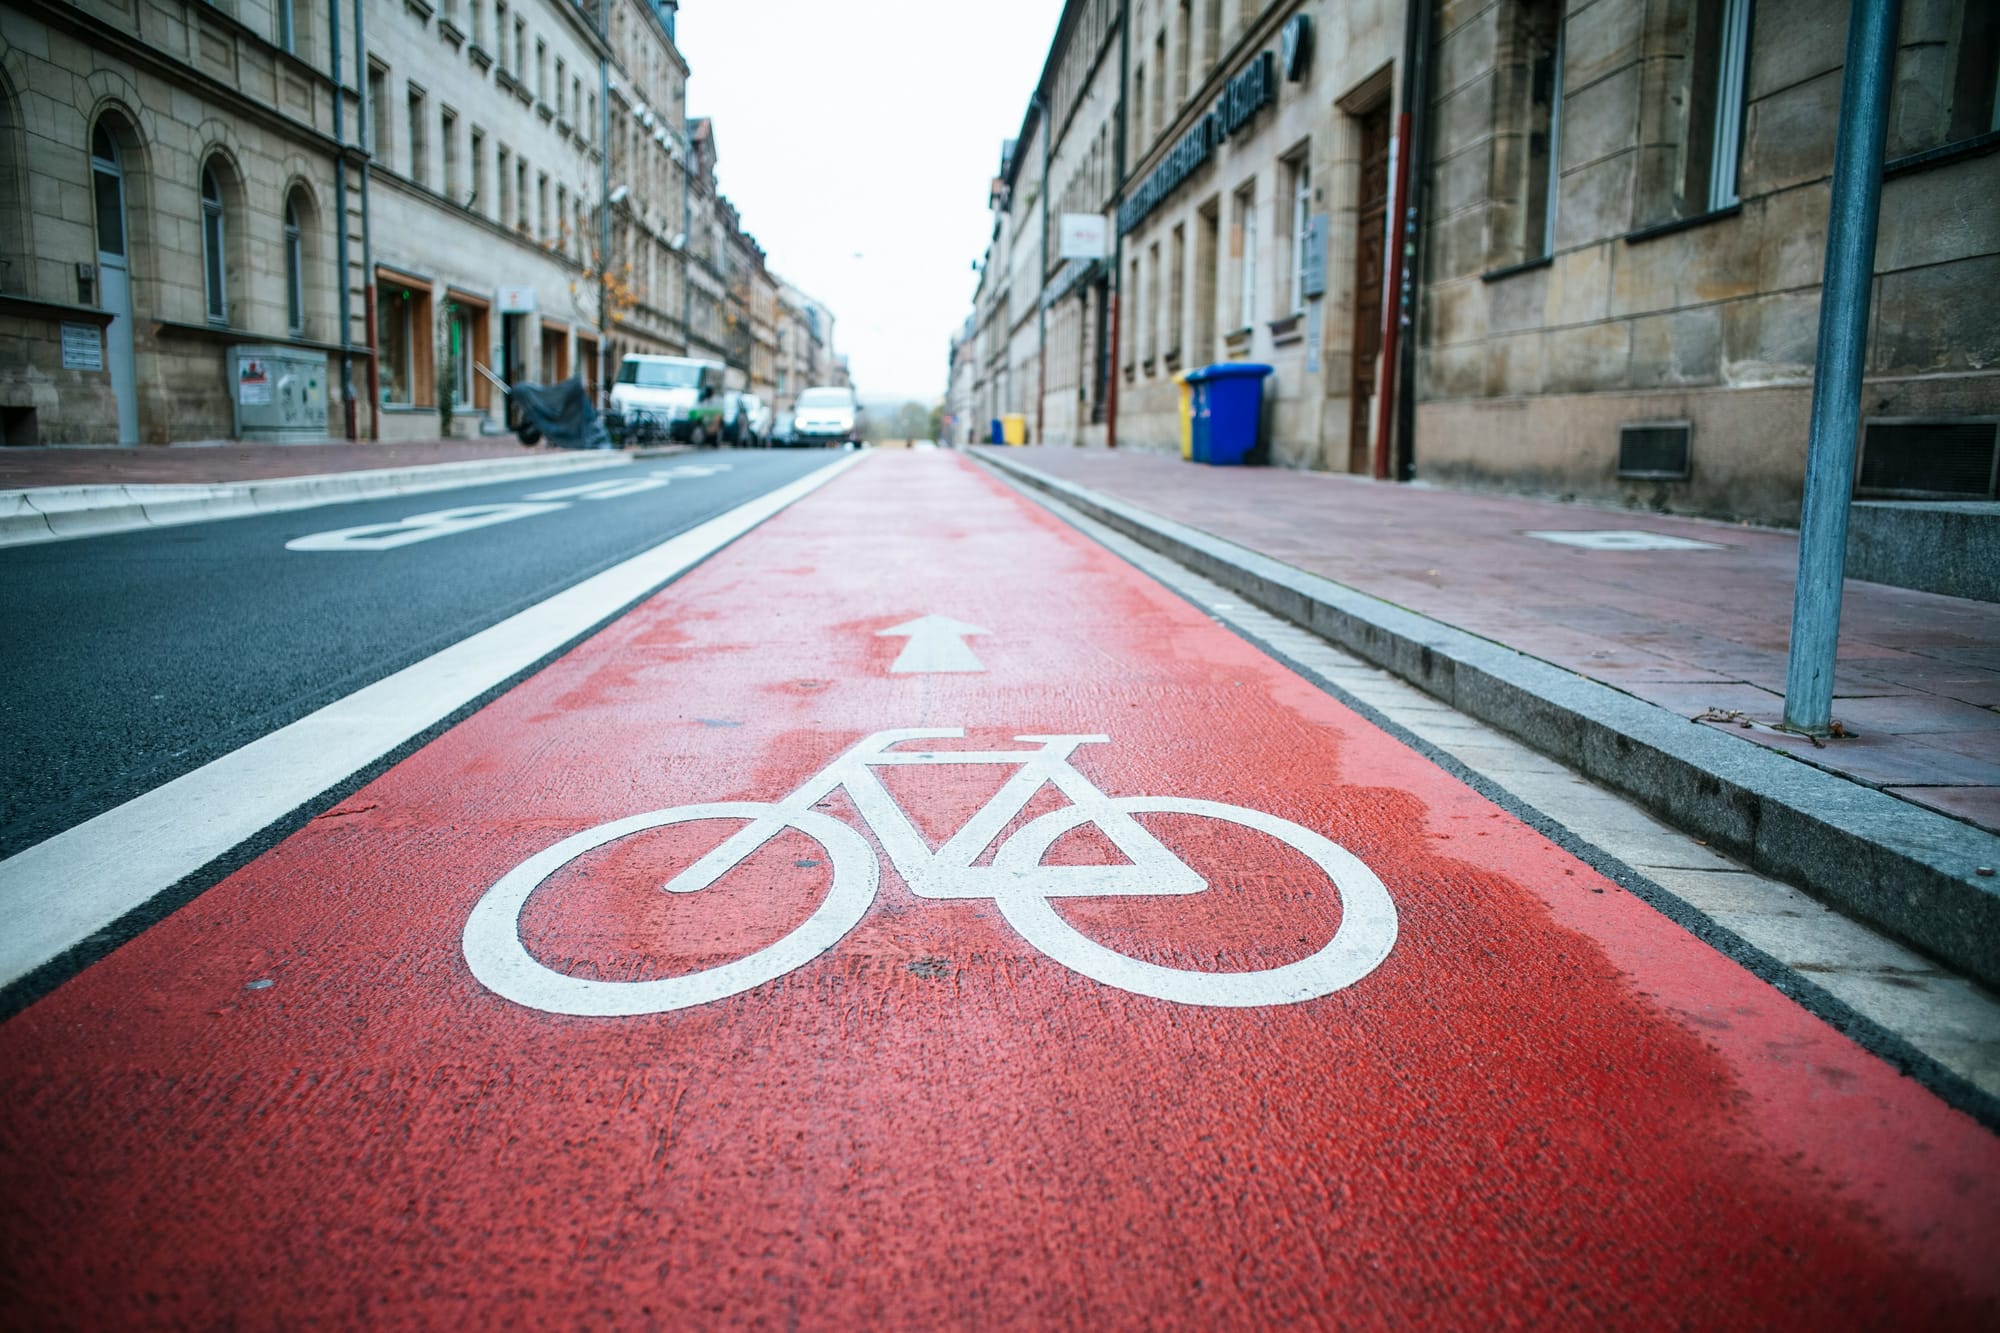
Providing better footpaths, safer crossings, protected bike infrastructure will make active transport safer and attractive. As cities and countries that have lead this movement internationally have shown, the built environment has considerable influence on health outcomes.
The National Heart Foundation of Australia’s Blueprint for an Active Australia noted this in Action Area One, Built Environment:
ensuring that the design of streets and public space prioritises the needs of people over motor vehicles. About 80% of the public realm of a city is made up of roads. Streets should be planned and designed according to their role as a “place” as well as their role in “movement”. As a place, a street is a destination in its own right and the design should consider the needs of people and active travel over car use [3]
It also means a life with social connection - whether it be a smile from a stranger, a conversation with neighbours, friend or family or being part of a community or interest group. We think our streets and public places can help facilitate these connections much better than they currently do.
4. Do you have any example actions that could be considered under each focus area and enabler?
Through the planning scheme, and the regional land use strategies and policies that are being developed to support it, the Government has a very significant influence outcome over the form of the built environment. We would like to see the principles of Movement and Place to plan, design and deliver a transport system that provides a range of transport options and rebalances streets into more people-friendly places. This was foreshadowed in the draft Tasmanian Walk, Wheel, Ride Strategy 2024.
An example action of applying that would be to adjust the phrasing within the “Parking and Sustainable Transport Code” of the State Planning Provisions.
Current: C2.1.2 - To ensure that cycling, walking and public transport are encouraged as a means of transport in urban areas.
Amended - To ensure that cycling, walking and public transport are prioritised as a means of transport in urban areas for all ages and abilities.
This would emphasise the shift from ‘encouragement’ to making it a priority for how our streets are designed, which should in turn increase the funding allocation. We also think the emphasis on ‘all ages and abilities’ is vital, as the evidence from numerous studies shows that only 5% of Tasmanians feel safe riding on the road and mixing with traffic. [4]
We expect that there will be other changes we could suggest, once we have reviewed the Planning Provisions in more detail.
14. How can we make sure our strategy adapts to changing health needs and environments over the next 20 years?
In 2010, climate change was described as “the biggest global health threat of the 21st Century”, putting the “lives and wellbeing of billions of people at increased risk” (Costello et al. 2009, p. 1693). The projected effects of climate change have also been described as representing “an unacceptably high and potentially catastrophic risk to human health” (Watts et al. 2015). The World Health Organization (WHO) recognises the health impacts of a changing climate as overwhelmingly negative, with regions exhibiting the poorest health infrastructure being the least able to adapt, prepare and respond to the variety of increased health risks likely in a changing climate (World Health Organization 2017).
We suggest that the actions identified in Table 1: Tasmanian Climate Change and Health Roundtable: Priority areas and identified actions[5] be incorporated into the 20 year Preventive Health Strategy. Of note we highlight the following actions:
Priority 1: Health promoting and emissions reducing policies
- Develop a state policy for healthy spaces and places
- Increase active travel options:
- bike lanes
- accessible public transport
- support employees to purchase bikes/use healthy transport (consider perverse disincentives and FBT implications)
- Increase active travel options:
Priority 3: Supporting health and resilient communities
- Promote liveability agenda
- Community engagement
- State planning policies influenced
- Develop planning legislation supporting community action to support health
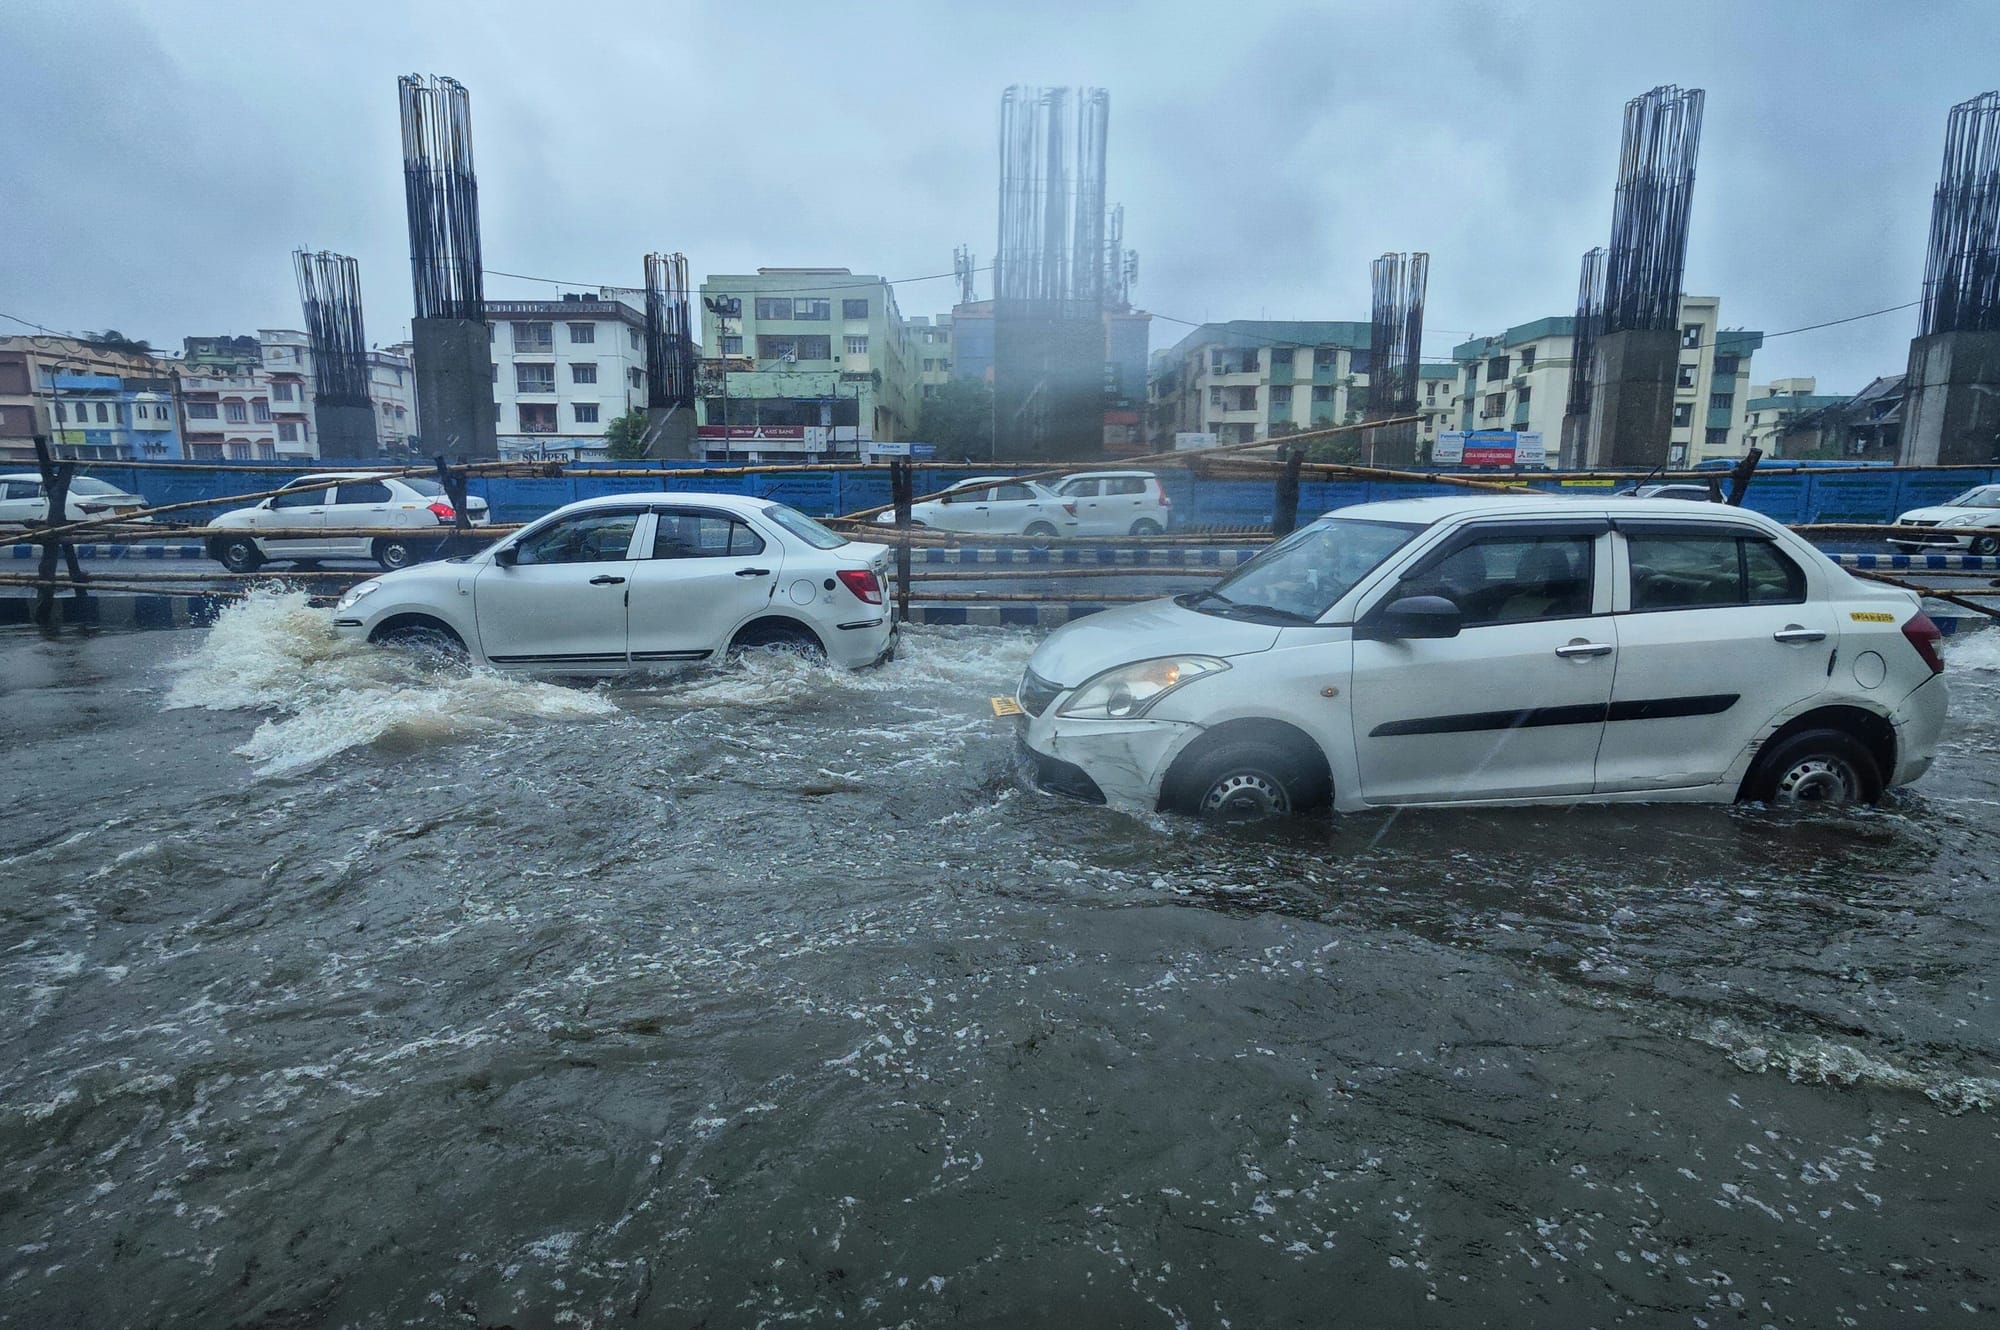
With a changing climate, there will be increased need for our urban environments to be adapted to cope with increased peak rainfall intensity, and more canopy. Our group sees these outcomes as being complementary to the design of people-friendly places. We have taken inspiration from a number of award-winning projects interstate and internationally that have achieved urban design outcomes that improve liveability, movement, and climate control through careful infrastructure design and planting selections. [6]
19. What funding mechanisms should be put in place to sustain preventive health efforts over the next 20 years?
We have seen at least eight strategies developed by State and local government to improve active transport over the past decade, but in most cases without any funding for implementation. We struggle to understand why, given the significant benefits that such investment generates.
Most business cases for walking and cycling infrastructure show around $5 return for every dollar invested in walking and cycling infrastructure. [7] Comparable data on road projects is hard to source, but early Benefit Cost Ratio analysis for the New Bridgewater Bridge had a range of $0.53-0.67 returned for every dollar invested. [8]
There are numerous well-researched papers on the approaches that could be considered by Governments to better fund active transport. One that we recommend is Proactive investment - Policies to increase rates of active transportation by The Australia Institute.
Preliminary analysis from the Greater Hobart Household Travel Survey (2023) shows that people are willing to use active transport:
- walking accounted for 16 percent of household daily trips in Greater Hobart, whereas cycling accounted for less than one percent of daily trips.
- 4% of households in greater Hobart own at least one e-bike
- There are 120,200 bicycles owned within Greater Hobart’s 95,000 households, so on average there are 1.3 bikes per household
- 9.2% of people rode a bike in the past week
- 67% of school students travel to school by car
- 31% of trips shorter than 5km are by active transport
There remains a significant gap to increase the percentage of short trips (<5km) by walking and cycling if the state is to achieve the 2034 target of 50% (as per progress indicator in draft Tasmanian Walk, Wheel, Ride Strategy, 2024). In order to achieve systemic change, there needs to be a significant increased investment in Active Transport, particularly the All Ages and Abilities (AAA) infrastructure. A connected network with this level of supportive infrastructure will help the “Enthused and confident” (13% of population), and “Interested but concerned” (37%) riders increase their rate of cycling.
We looked at the Greater Hobart Cycling Plan, which identified a connected network of 291km, specified as AAA standard. This was endorsed in December 2021 by the four metropolitan Councils and the State Government.
As of this 2024-25, only 83km (29%) of the network is AAA standard, however that was already largely built at the time the plan was agreed to. Based on how little progress there has been in the past 3 budget cycles, the network wouldn’t be completed until 2105 (in 80 years time!). [9]
For context, the construction of a shared pedestrian and cycle path separated from a road costs an estimated $2.0-$3.9 million per kilometre. [10] Therefore, to complete the remaining 208km of the network to the AAA standard would cost an estimated $416m - $811.2m.
Taken in context of the overall roads funding budget, this allocation is still modest. We note the forward estimates for roads and bridges over the coming three years (2025-26 to 2027-28) to be $1,377.1m. [11]
Using the 20-year span of the Preventive Health Strategy, we recommend using the higher figure of $811.2m and spreading this investment over 20 budgets to complete the Greater Hobart network. This would average to $40.56m per year, or $72.74 per Tasmanian each year [12] (over time, some adjustments would need to be made for inflation).
By comparison, the proposed budget allocation for cycle infrastructure in 2025-26 is $2.4m, which is only $4.30 per Tasmanian each year. What we find alarming is that the proposed allocations in 2026-27 fall to $2.0m and $0.5m in 2027-28 (the latter would be 89 cents per Tasmanian). We must do better.
If we consider this $811.2m investment over 20 years for Tasmania, using metrics that Department of State Growth have endorsed through their draft Walk Wheel Ride Strategy, it would generate:
- $4.05b economic return (based on a $5 return for every dollar invested) [13]
- $565m per annum in health benefit - on the presumption this infrastructure achieves a 10% modal shift, in that an additional 72,940 of the 729,400 daily trips were taken by bike (we used Greater Hobart Household Travel Survey 2023 data, with an 8.7km average trip distance). [14]
These outcomes should not be measured on dollar value alone, as they will also help to significantly reduce the burden on staff working in our acute care systems. As noted by PHAA CEO, Adj Prof Terry Slevin in relation to this Strategy:
“Preventive health measures take time to show results, but they reduce pressures on Tasmania’s ambulances and hospital systems, and are a smart use of the public’s money. Prevention is playing the long game in health, and Tasmanians have the right to expect their government to look into the future to safeguard their health."
As a local example, the City of Hobart’s investment in the Hobart Rivulet Track over the past 20 years sets a strong precedent. The rates of cycling to work by South Hobart residents increasing from 2% in 2001, to 5% in 2011, and 7% in 2021 (ABS Census, 2001, 2011, 2021). We expect to see this rate to increase at the next census, with the tactical trial of protected cycle lanes along Collins Street improving the connection to the city centre.
We feel this level of investment aligns with the statement by Dr Scott McKeown, Deputy Director of Public Health:
“Preventive health can no longer be seen as a luxury – it is an essential investment in the future wellbeing of Tasmanians and the financial sustainability of our state.” [15]
We also note that the averaged allocation of $40.56m per year would start to approach international best practice, with indications ranging from 10% to 20% of road-related expenditure being allocated for active transport. [16] We recommend that the Strategy sets the upper range as its long-term goal - for 20% allocation by 2046.

Conclusion
As noted in the draft Tasmanian Walk, Wheel, Ride Strategy, 2024, there has been a term ‘bike-lash’ to describe the resistance to redesigning streets where it reduces on-street parking. The strategy noted the value of meaningful engagement with stakeholders, and we are keen to work with State and local governments to help gain broader community support.
We trust this is helpful in preparing the draft Strategy, and in making a case to increase funding allocation. We would welcome being a part of any ‘roundtable’ or future consultation sessions that the Department organises either to develop the actions or monitor their implementation. We can be contacted by email:
Yours sincerely,
Mark Donnellon on behalf of Streets People Love Hobart
Sources:
- Department of Health, (2022). Healthy Tasmania Five Year Strategic Plan 2022-2026 https://www.health.tas.gov.au/sites/default/ files/2022-03/Healthy_Tasmania_Five-Year_Strategic_Plan_2022%E2%80%932026_DoHTasmania2022.pdf
- https://www.phaa.net.au/Web/News/Media-releases-2025/TAS-Govt-needs-to-match-its-preventive-health-strategy-with-money.aspx
- page 16 of https://assets.contentstack.io/v3/assets/blt8a393bb3b76c0ede/blt7921be9a27021d82/65a87852cdbb969bc8c4fe11/01_Blueprint_Built_Environment.pdf
- As per “Strong and fearless’ cohort within the graphic on page 9 of the draft Tasmanian Walk, Wheel, Ride Strategy 2024 with data sourced from Cycling and Walking Australia and New Zealand (2023) National walking and cycling participation survey
- Tasmanian Climate Change and Health Roundtable Final Report June 2020
- Sheffield, UK - Grey to Green ; Adelaide, SA - North-South bikeways
- Graphic titled “Local economic benefit’ on Page 8 within DRAFT_Tasmanian_Walk_Wheel_Ride_Strategy
- Infrastructure Australia, 2019, Derwent_river_crossing_capacity_-_evaluation_summary New Bridgewater Bridge - Submission_to_Parliamentary_Standing_Committee
- Greater Hobart Cycling Plan 2019
- Australian Transport Assessment and Planning (2023) Australian transport assessment and planning guidelines M4 Active travel, p 55, https://www.atap.gov.au/mode-specific-guidance/active-travel/index
- The Budget, Budget Paper No. 1 (2024-25), Roads Program - Table 6.4, pp 140-142), Tasmanian Government.
- Residential population of 557,571 as per Tasmania 2021 Census All persons QuickStats
- Valuation metric sourced by Dept of State Growth from Queensland Department of Transport and Main Roads (2023); Queensland Cycling Infrastructure Investment Strategy and Business Case 2016–2026
- Valuation metric sourced by Dept of State Growth from Wanjau, M, Möller, H. Haigh, F. Zapata-Diomedi, B. Veerman, L. (2022). Griffith University, The George Institute for Global Health & University of New South Wales
- Australian Partnership Prevention Centre, 8 May 2025, https://preventioncentre.org.au/news/tasmania-begins-work-on-a-20-year-preventive-health-strategy/
- Adhikari, Ryan, Harrington, 2024: Proactive investment - Policies to increase rates of active transportation, p5 and https://www.un.org/sustainabledevelopment/blog/2016/10/un-environment-report-put-people-not-cars-first-in-transport-systems/